Willard Cope Brinton's second book Graphic Presentation (1939) surprised me with the quality of its graphics. Prof. Michael Stoll has some scans at Flickr. For example:
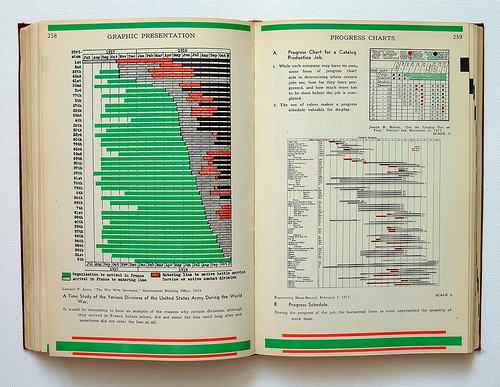
The whole book can be downloaded (in a worse resolution) from Archive.Org.
Willard Cope Brinton's second book Graphic Presentation (1939) surprised me with the quality of its graphics. Prof. Michael Stoll has some scans at Flickr. For example:
The whole book can be downloaded (in a worse resolution) from Archive.Org.


Those do look very nice. I guess when you have to spend 10+ hours creating a single figure by hand, you may tend to put a bit more thought into what it should look like.
Beautiful. I was surprised not to see any scatterplots. Perhaps scatterplots had not yet been invented?
Scatterplots go back to at least John Herschel in the 19th century.
Friendly, M., and D. Denis. 2005. The early origins and development of the scatterplot. Journal of the History of the
Behavioral Sciences 41: 103–130.
The chart at the top of page 259 shows early Harvey Balls, years before Harvey Poppel.
As Alex notes, this was Brinton's second book. His earlier "Graphic methods for presenting facts" New York: Engineering Magazine Company, 1914 is also worth a look for e.g.
emphasis on difficulties of using two-dimensional and three-dimensional graphics
a critique of pie charts [not yet so named] and other circular representations
stress on merits of horizontal and left-to-right alignment
examples of spineplots and parallel coordinate plots
scatter plots with "smooth" curves superimposed