McKinsey had a great chart today:
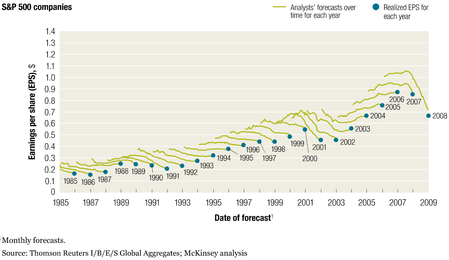
To explain the chart - the green are the predictions for the next year at various times in the past. The blue is the truth that eventually comes along. So, the predictions do tend towards the truth as time goes on.
They're consistently optimistic - but does the data justify a more sophisticated model? Or is the design of markets inherently biased towards rewarding optimists more than realists?


I found the x-axis and the year labels on the blue dots are very confusing here. After looking at it for a while, I figured that the year labeling in the x-axis is associated with the year starting at the left tick mark. But the result doesn't come till the end of the year (and predictions continue throughout the year) so we end up with the blue dot showing the result of the preceding year (with the preceding year's label) directly above the label for the new year! Maybe the x-axis labels could be moved to sit between the tick marks?
How about neither? Instead: the role of the analyst is inherently biased towards rewarding optimists more than realists. When people interview the analysts after they leave their job on the analysis side, they all essentially say that their reward structure is to be overoptimistic.
The cases that fail this test in your graph are "bubble years" when the analyst successfully contributes (along with many others) to fostering the notion of "things are better than they appear" which leads to huge profits for their firms and more rewards for them personally.
The main years where the trend goes up toward the end are 2003 through 2006. In 2005 and 2006 the trend was entirely up. 1988 was pretty much flat. So sometimes this pattern is reversed.
Maybe the traumas of 1987 and 2000-2002 affected the incentives or models? (1987 and 2000 weren't traumatic years for EPS, but the markets experienced pretty dramatic trauma.)
If this pattern is consistently affected by traumas, we should expect a few years in which the estimates undershoot and then increase toward the end. Since we've just had the biggest trauma in living memory, the effects should be big.
I think this is an insightful point, and I agree with it completely. Analyst predictions are more of a marketing tool for big banks than anything else.
I am still not clear how to reconcile the year labels on the x-axis and the blue-dot years. One way to interpret it is that it takes about a year to have all the forecasters adjust their numbers retroactively to reflect the reality :)
@David & @Kaiser: Agreed!
@Stephen: You put it better than I did.
@Jed: Interesting!
Another problem with the graph is that the dollar values (y-axis) aren't adjusted for inflation -- presumably earnings per share remain relatively constant as a proportion of share value -- so we can't easily tell whether forecasts are getting better or worse over time. Indeed, not showing EPS on a relative scale makes it look as if forecasts are getting worse. Of course, the graph relies of the increase in the dollar value so all the green lines don't overlap....
Does this plot say that in January 2000 they were forecasting that 2002 would be worse than 2001? That sounds odd to this layman.