There was a dynamic discussion on gender differences in performance a few days ago. Many interesting points were raised, but most of them regarded differences in models (variance, mean), rather than differences in distributions.
One of the comments referred to the Project TALENT database from 1960. It's one of the most exhaustive datasets of its type.
I have been unhappy for quite some time because papers do not show the actual data. For that reason I wrote a small plotting program that allows visual comparisons of histograms. The plentiful TALENT data makes it possible to avoid binning or kernel smoothing. Here are some plots:
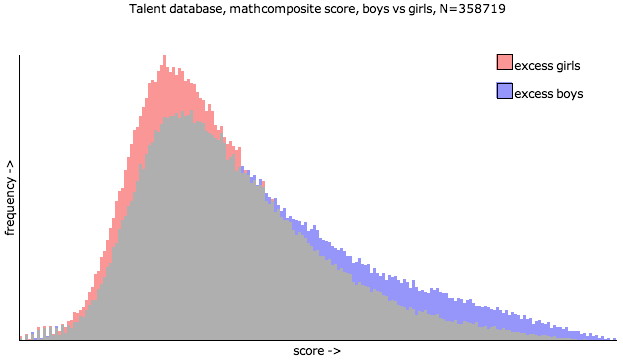
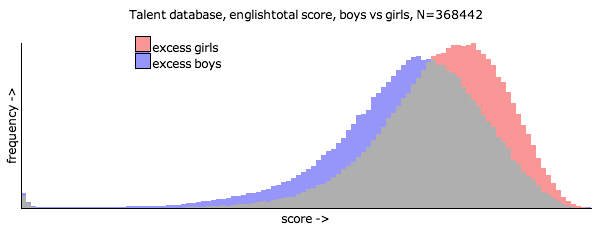
The pink histogram is for girls, the blue one for boys, and where the pink and blue overlap, there is grey.
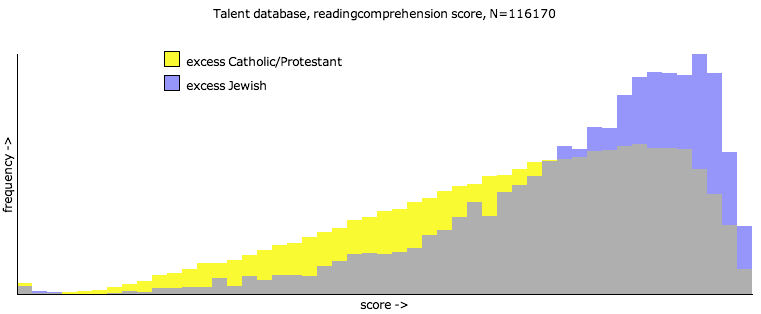
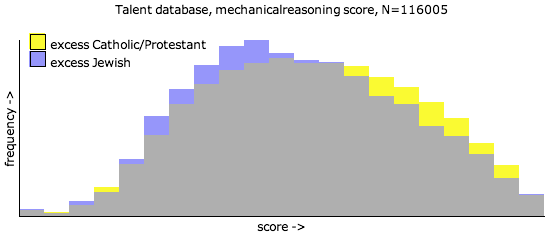
It is interesting to observe the skew, which might indicate incentives, learning curves or unbalanced tests. One of the most striking examples of skew is the difference in reading comprehension between Catholic/Protestant and Jewish populace, but I also list mechanical reasoning:
Project TALENT's data is from 1960, so things might have changed since then. Nowell & Hedges discuss some trends from 1960-1994.
In the end, let me reiterate that this posting does not make any statements about the causality of these differences - I am merely providing the data as such. The only assumptions were that the missing values can be dropped (boys were overrepresented in this respect) and that both underlying populations are comparable (no systematic effects with respect to extraneous biases such as age).
I did NOT observe boys being overrepresented on the low end of the spectrum for mathematics scores - but this could easily happen if one isn't careful throwing out the missing values coded with "-1" (5.4% among boys, 4.4% among girls).


That looks surprisingly log normal to me.
Tiny point about your graphs: "excess" (for some) is at least mildly value-laden -- not a word you want when writing about sensitive topics. "more" is shorter, simpler and as far as I can see unproblematic.
A bigger point about your graphs: I'd like to see quantile-quantile plots too, as used in one of his books for similar data by William S. Cleveland.
Is it possible to further break down the "Catholic/Protestant" group by religion and/or ethnicity?
And--it would appear unlikely--but do you happen to know if the Project TALENT database is available online?
That, sir, is why we pay you the big bucks. Thanks for doing this.
i think you can find the data at icpsr.
https://www.icpsr.umich.edu/ICPSR/
To n/a: it is not available online as far as I know. The American Institute for Research will supply it on CDs, but it takes a long time. One of their masters is bad, so they must be checked when you get them.
It is a rich set of data but the documentation is very bad. Lots of it is to be found in reports available (in the 1960s) from some department or other: today these cannot be tracked down in my experience.
As you point out, those data are from 1960 when there was apparently a
much bigger difference in means between the two groups, so even a large
variance ratio might not result in the boys' distribution's probability
mass function exceeding the girls' at the low end.
In the Science data, though, based on 2005-2007 statewide math tests,
the overall difference in means was deviation, and the overall ratio of variances was >1.11. I think it
would be difficult to fix the first and second moments of the two
distributions like this and NOT find the boys exceeding the girls on the
low end, although a pathological case is possible.
There is other empirical support for
the idea that boys have recently been overrepresented at both extremes.
E.g., in the 2000 administration of the NAEP mathematics test to 12th
graders without accomodations permitted, the 10th percentile among boys
was at a score of 253.98, versus 256.17 for girls. (The 10th-percentile
girl scored better than the 10th-percentile boy.) Meanwhile, the 90th
percentile among boys was 350.19, versus 341.23 for girls.
(90th-percentile boy scored better than the 90th-percentile girl.) I got
the figures from the NAEP data explorer.